2. Creating a first stimulus#
This tutorial introduces the basics of stimulus generation with stimupy
and shows how to create your first stimulus.
At its core, stimupy provides a large set of functions
that each draw a specific (visual) component or image.
In this part of the tutorial, we’ll look at three examples of such stimulus-generating functions.
Tip
You can launch this tutorial as an interactive Jupyter Notebook on Binder – see the Binder icon at the top of the page.
2.1. Example 1: A Gabor#
One of the most common stimuli in vision science is the Gabor patch – a sinusoidal grating enveloped by a Gaussian.
In stimupy, Gabors are implemented in the stimupy.stimuli.gabors module.
So, to use this function, we must first import it.
Then, we call it function with some specification for several parameters,
which hopefully make intuitive sense:
from stimupy.stimuli.gabors import gabor

stim = gabor(visual_size=4, ppd=50, sigma=0.5, frequency=4, rotation=45, phase_shift=0)
2.1.1. Resulting stimulus#
The resulting stimulus is a Python dict,
which contains several parts:
"img"– anumpy.ndarraycontaining the stimulus image.All the parameters used to generate the stimulus
Space for any additional metadata you wish to add
print(stim.keys())
dict_keys(['img', 'grating_mask', 'visual_size', 'ppd', 'shape', 'frequency', 'n_phases', 'phase_width', 'period', 'rotation', 'phase_shift', 'round_phase_width', 'origin', 'distance_metric', 'sigma', 'gaussian_mask', 'intensities'])
The "img" is of course the most important:
this is a 2D numpy.ndarray, representing an array of pixels.
The value of each array element is the intensity of the pixel,
in range \([0,1]\) (‘black’ to ‘white’).
print(stim["img"])
[[0.5        0.50000002 0.50000005 ... 0.50000007 0.50000007 0.50000007]
 [0.49999998 0.5        0.50000003 ... 0.50000006 0.50000007 0.50000007]
 [0.49999995 0.49999997 0.5        ... 0.50000002 0.50000006 0.50000007]
 ...
 [0.49999993 0.49999994 0.49999998 ... 0.5        0.50000004 0.50000007]
 [0.49999993 0.49999993 0.49999994 ... 0.49999996 0.5        0.50000003]
 [0.49999993 0.49999993 0.49999993 ... 0.49999993 0.49999997 0.5       ]]
You can use stimupys plotting routine to plot the stimulus:
from stimupy.utils import plot_stim

plot_stim(stim)
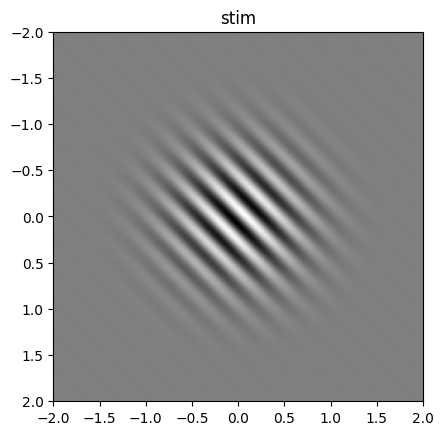
<Axes: title={'center': 'stim'}>
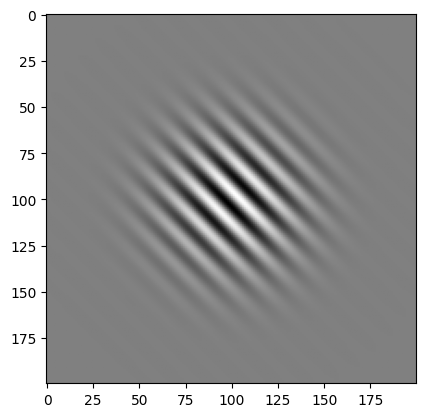
Alternatively, since the stimulus is a numpy.ndarray,
you can use your preferred way of showing a numpy.ndarray on the stim["img"] array,
e.g. matplotlib.pyplot.imshow():
import matplotlib.pyplot as plt

plt.imshow(stim["img"], cmap="gray")
plt.show()
2.1.2. Parametrization#
To generate the Gabor, we specified some relevant parameters:
visual_size– image size (degrees)ppd– pixels per degree (resolution)sigma– size of Gaussian envelope (degrees)frequency– cycles per degreerotation– orientation in degreesphase_shift– phase offset in degrees
The gabor function takes many more arguments and parameters though.
All are listed in the documentation, which can be viewed both
here online ( stimupy.stimuli.gabors.gabor() )
and from within Python:
help(gabor)
Help on function gabor in module stimupy.stimuli.gabors:

gabor(
    visual_size=None,
    ppd=None,
    shape=None,
    frequency=None,
    n_bars=None,
    bar_width=None,
    period='ignore',
    rotation=0.0,
    phase_shift=0,
    intensities=(0.0, 1.0),
    origin='center',
    round_phase_width=False,
    sigma=None
)
    Draw a Gabor: a sinewave grating in a Gaussian envelope

    Parameters
    ----------
    visual_size : Sequence[Number, Number], Number, or None (default)
        visual size [height, width] of image, in degrees
    ppd : Sequence[Number, Number], Number, or None (default)
        pixels per degree [vertical, horizontal]
    shape : Sequence[Number, Number], Number, or None (default)
        shape [height, width] of image, in pixels
    frequency : Number, or None (default)
        spatial frequency of grating, in cycles per degree visual angle
    n_bars : Number, or None (default)
        number of bars in the grating
    bar_width : Number, or None (default)
        width of a single bar, in degrees visual angle
    sigma : float or (float, float)
        sigma of Gaussian in degree visual angle (y, x)
    period : "even", "odd", "either" or "ignore" (default)
        ensure whether the grating has "even" number of phases, "odd"
        number of phases, either or whether not to round the number of
        phases ("ignore")
    rotation : float, optional
        rotation (in degrees), counterclockwise, by default 0.0 (horizontal)
    phase_shift : float
        phase shift of grating in degrees
    intensities : Sequence[float, ...]
        maximal intensity value for each bar, by default (0.0, 1.0).
    origin : "corner", "mean" or "center"
        if "corner": set origin to upper left corner
        if "mean": set origin to hypothetical image center (default)
        if "center": set origin to real center (closest existing value to mean)

    Returns
    -------
    dict[str, Any]
        dict with the stimulus (key: "img"),
        mask with integer index for each bar (key: "grating_mask"),
        and additional keys containing stimulus parameters
Any parameter that you don’t specify either uses its default value,
or a value that can be deduced from other specified parameters.
All the parameters – both those we specified, and the ones determined by stimupy –
are part of the output stimulus-dict:
print(stim.keys())
print(print(f"{stim['intensities']=}"))
print(print(f"{stim['phase_width']=}"))
dict_keys(['img', 'grating_mask', 'visual_size', 'ppd', 'shape', 'frequency', 'n_phases', 'phase_width', 'period', 'rotation', 'phase_shift', 'round_phase_width', 'origin', 'distance_metric', 'sigma', 'gaussian_mask', 'intensities'])
stim['intensities']=(0.0, 1.0)
None
stim['phase_width']=0.125
None
2.2. Example 2: A rectangle#
stimupy also provides basic geometric shapes,
located in the stimupy.components.shapes module.
Generating this follows the same steps as the Gabor:
from stimupy.components import shapes

stim = shapes.rectangle(visual_size=(6,8), ppd=10, rectangle_size=(4,4))
plot_stim(stim)
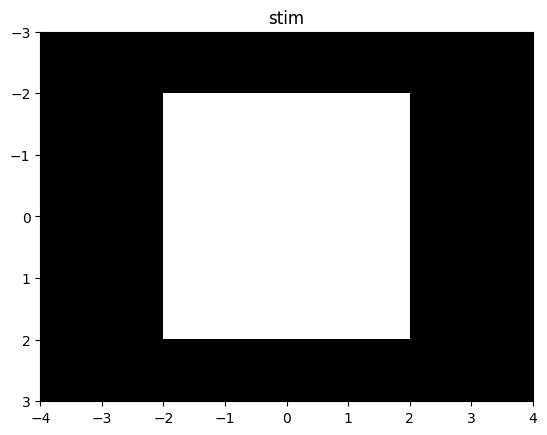
<Axes: title={'center': 'stim'}>
Note that here we used some arguments that we also used for the Gabor
(visual_size and ppd),
and some that are specific to the rectangle function.
Since a rectangle is different from a Gabor, we can specify different aspects of it, e.g.:
rectangle_size– width × height (degrees)rectangle_position– position from top-left corner (degrees)intensity_rectangle– brightness of rectangleintensity_background– brightness of background
Example with different size and intensity:
stim = shapes.rectangle(
    visual_size=(6,8),
    ppd=10,
    rectangle_size=(4,2),
    rectangle_position=(1,2),
    intensity_rectangle=.7
)

plot_stim(stim)
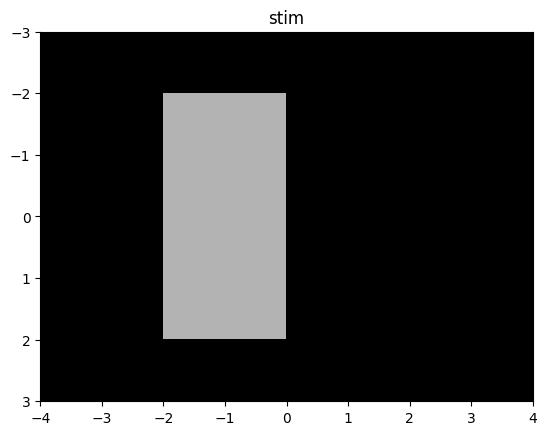
<Axes: title={'center': 'stim'}>
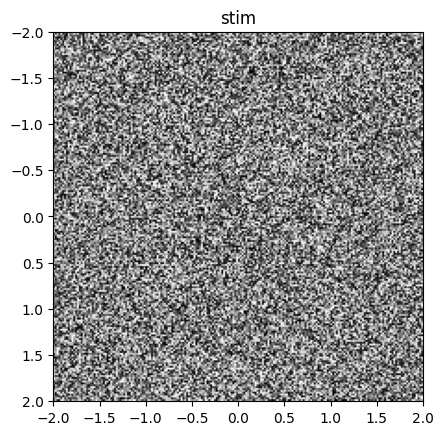
2.3. Example 3: White noise#
Another classic stimulus is white noise – an array of random pixel intensities.
White noise is provided in stimupy.noises.whites:
from stimupy.noises.whites import white

stim = white(visual_size=4, ppd=50)
plot_stim(stim)
<Axes: title={'center': 'stim'}>
For this stimulus, we specified only the image size parameters visual_size and ppd`.
The are other parameters for this function, for which stimupy used the default values.
2.4. In general#
A stimupy stimulus is:
A Python
dictContaining
"img"as anumpy.ndarrayIncluding all parameters used to generate it
Advantages:
Self-contained and reproducible
Compatible with any NumPy-based workflow
Caution
Once created, anything in the resulting stimulus-dict can be modified by the user.
stimupy does not enforce any post-creation validation.
Thus, you can change, e.g., the value of ppd in the stimulus-dict
but this does not alter the stimulus.
Instead, it would mean the image and parameters in the stimulus-dict are
no longer congruent
Handle with care!
2.4.1. Stimulus parameters#
All stimupy stimulus-functions require and take multiple arguments. These control, for example:
Image size & resolution
visual_size,ppd, orshape(pixels)these are over-complete: because of their interdependency, you only need to specify 2 of 3.
for more information, see the User Guide on Image size and resolution
Stimulus-specific geometry
e.g.,
sigma,frequencyfor Gabore.g.,
rectangle_sizefor rectangles
Photometric properties
e.g.,
intensitiesfor Gabore.g.,
intensity_rectanglefor rectanglesall
stimupystimuli by default are in the range \([0, 1]\)
You can check a function’s parameters in the function reference or via Python’s help():
help(gabor)
Help on function gabor in module stimupy.stimuli.gabors:

gabor(
    visual_size=None,
    ppd=None,
    shape=None,
    frequency=None,
    n_bars=None,
    bar_width=None,
    period='ignore',
    rotation=0.0,
    phase_shift=0,
    intensities=(0.0, 1.0),
    origin='center',
    round_phase_width=False,
    sigma=None
)
    Draw a Gabor: a sinewave grating in a Gaussian envelope

    Parameters
    ----------
    visual_size : Sequence[Number, Number], Number, or None (default)
        visual size [height, width] of image, in degrees
    ppd : Sequence[Number, Number], Number, or None (default)
        pixels per degree [vertical, horizontal]
    shape : Sequence[Number, Number], Number, or None (default)
        shape [height, width] of image, in pixels
    frequency : Number, or None (default)
        spatial frequency of grating, in cycles per degree visual angle
    n_bars : Number, or None (default)
        number of bars in the grating
    bar_width : Number, or None (default)
        width of a single bar, in degrees visual angle
    sigma : float or (float, float)
        sigma of Gaussian in degree visual angle (y, x)
    period : "even", "odd", "either" or "ignore" (default)
        ensure whether the grating has "even" number of phases, "odd"
        number of phases, either or whether not to round the number of
        phases ("ignore")
    rotation : float, optional
        rotation (in degrees), counterclockwise, by default 0.0 (horizontal)
    phase_shift : float
        phase shift of grating in degrees
    intensities : Sequence[float, ...]
        maximal intensity value for each bar, by default (0.0, 1.0).
    origin : "corner", "mean" or "center"
        if "corner": set origin to upper left corner
        if "mean": set origin to hypothetical image center (default)
        if "center": set origin to real center (closest existing value to mean)

    Returns
    -------
    dict[str, Any]
        dict with the stimulus (key: "img"),
        mask with integer index for each bar (key: "grating_mask"),
        and additional keys containing stimulus parameters